What Is a Relationship Chart? Meaning, Types & How to Draw One
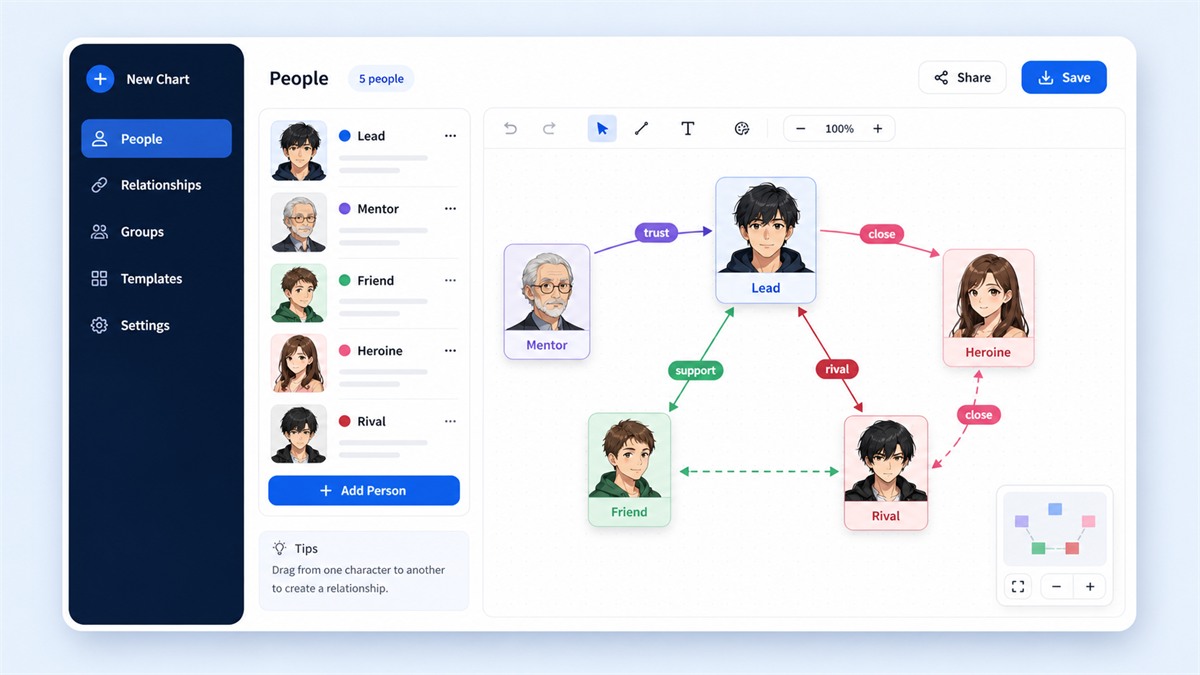
A relationship chart is a diagram that shows how people (or characters, teams or ideas) are connected, using lines and labels on a single page. It is common on TV drama sites and at the back of novels because a sentence like “A is B’s wife and C’s ex; C works under B…” is confusing, but a chart lets you see the whole picture at a glance.
Relationship chart, relationship diagram, character map
These terms are used almost interchangeably. “Relationship chart” and “relationship diagram” are general; “character map” or “character relationship chart” usually means a chart of fictional characters; “connection chart” or “stakeholder map” is common in business. The same tool can make all of them.
How to draw a relationship chart in 4 steps
- List the people or elements. Write down the names, titles and a note about each.
- Place them as cards. Put closely related people near each other and distant ones apart.
- Connect them and add labels. Add short labels such as “spouse”, “rival” or “former boss”. Use an arrow for one-way relationships such as a crush or a chain of command.
- Tidy the layout. Check that lines do not cross too much and that the main person is near the center. Color groups when the cast is large.
You can draw one on paper or in Excel, but charts grow as stories grow, so a tool with people cards and labeled lines built in is much faster. Relationship Chart Maker is free to start and needs no sign-up. For more detail, see the complete beginner’s guide.
Tip: if you want a chart drafted from text, paste a synopsis or setting notes into the AI chart generator.
Common types of relationship chart
Family type
Generations stacked top to bottom, with marriage and parent-child lines. Good for organizing a family in a drama or novel.
Organization type
Roles arranged in levels, with lines for reporting and teams. Good for a company or project team.
Romance type
Crushes and love triangles. A one-way arrow for a one-sided crush and a two-way line for mutual feelings. Also used for ship charts.
Network type
Any mix of blood ties, romance, rivalry and work. Good for mysteries and ensemble casts.
Start from a type close to what you need in the template gallery.
How it differs from a family tree, org chart and mind map
- Relationship chart: any kind of relationship between people, in a free network layout.
- Family tree: only blood and marriage ties, in generations.
- Org chart: reporting lines only, as a pyramid, with no feelings.
- Mind map: ideas radiating from a center; the nodes are concepts, not people.
In other words, a relationship chart can put blood ties, romance, rivalry and work on one page. Family trees and org charts are specialized versions.
What relationship charts are used for
- Watching and reading: keeping track of a large cast, especially in mysteries.
- Writing and worldbuilding: managing character settings so relationships stay consistent.
- Games: a game master’s map of NPCs and factions in a TTRPG or murder-mystery game.
- Business: stakeholder and key-person maps that show real influence beyond the official org chart.
- Study: historical figures or a long novel’s cast, so you understand rather than memorize.
FAQ
What does a relationship chart show?
It shows how people or things are connected: who is family, who is rivals, who works with whom, using lines and labels.
How many people can I put on one chart?
On the free plan, up to 6 people per chart. Premium allows 7 or more. For readability, more than about 16 people are hard to follow on one page, so consider splitting the chart by group.
Does a saved image have a watermark?
Free exports include a small watermark. Premium removes it and adds PDF and SVG export.
Want to try it? It’s free and needs no sign-up.
Make your own relationship chart